 Climate Model Data Management
Remote Sensing Data Management
Climate Model Data Management
Remote Sensing Data Management

This section describes the third layer in the Big Sur database infrastructure: applications. This section gives an overview of the following application areas as the developers of Big Sur understand them:
Climate Model Data Management
Remote Sensing Data ManagementFirst, we will list the demands Earth Science researchers will make of the Big Sur system. Next, we will describe in detail the characteristics of the data which each application produces and which Big Sur will be required to manage. Finally we examine in some detail queries which have been identified as typical of what day to day operations will be like.
Throughout this document extensive mention will be made of two prototype systems which have been created as part of Sequoia 2000 Phase I. These were the EOS Alternative Architecture Study Prototype described in [ALTEOS94] and a prototype written by Keith Sklower which managed considerable amounts of GCM data in Postgres. The lessons learned from these exercises will play an important part in the development of Big Sur.
In [WMGN93] the authors describe an approach to research in the area of Ocean-Atmosphere interaction. This approach involves employing a DBMS as an analysis tool for posing queries which validate the results of current models, as an engine to generate new results from enhanced models, as a 'scientific notebook' to assist in the discovery of specific data with desired features, and as a catalog of models as they are developed. Our intention is that Big Sur will fulfill all of these requirements.
Climate modelers want to investigate their predictions through comparisons with other models and real world data, perform feature extraction (ie look for interesting things like cyclones) and better understand the nature of their predictions by visualization using specialist tools.
In [ALTEOS94] validating climate models using surface meteorological and hydrological data was identified as an important scenario both in terms of the scientific service it performs and the computer science problems it presents. Such validation effort will require Big Sur to manage data of the agencies like the National Meteorological Center (NMC) and the European Center for Medium Range Forecasting (ECMWF) in addition to GCM data.
The 'holy grail' of this effort involves using data from the second Big Sur application - Remote Sensing - to computationally steer GCM models.
Such research involves generating enormous amounts of data and consumes lots of expensive cycles on big iron. Saving this data in a mass storage manager and managing it through a database has proved in Sequoia Phase I to be an effective alternative to re-computing it.
GCM data can be thought of in geo-science terms as a Coverage [SAIF94], or in computer science terms as a multi-dimensional array. One GCM run computes the values of several real world physical quantities (temperature, pressure, wind speed and so on) throughout the atmosphere for some time period. This information is 'gridded' or 'tiled' into sections which correspond to some area of latitude, longitude (4 degrees by 5 degrees) over some range of altitude (every 100 millibars of pressure)). Each spatio-temporal location's value is calculated to be true for some small period of time (6 hours).
In Keith Sklower's prototype system, the values of 23 variables over an eleven year period was stored in the 'Metrum' at Berkeley, and the associated meta-data was stored in a Postgres database.
Due to file size limitations on our existing HSM technology, we were obliged to break these large data sets down into smaller files. This introduced an additional layer of complexity to the system and it is desirable that the application shield its users from such messy details in keeping with the objectives of DBMS systems.
This application will require the creation of arbitrary Grids. These Grids will be the result of hyperslab extraction from larger Grids, or the result of combining the information in several Grids. These Grids will need to be based on the re-combination of components of other Grids.
As part of Sequoia Phase I, an entire feature extraction system, QUEST [MESR94] was developed which, in order to be effective, requires the evaluation of ad-hoc SQL queries over the data set. In Phase II the next generation of this prototype, called ConQUEST, will make use of the Big Sur schema.
These queries are taken from [WMGN93] except the last, which is my own creation.
This is an example of using the DBMS as a scientific note book, to facilitate timely discovery of data.
This illustrates the use of the DBMS as an analysis engine. So long as the functions which answer the comparison questions are available extensible database environments can handle this type of query.
This shows how a system like Big Sur could be required to produce data. Such information may be available already - because a previous model run to these specifications has been stored - or it's possible that data may be generated by another aspect of the application.
This example extracts a hyperslab from the data set and uses this extracted data as input to a visualization tool, like Tecate [KOCH94].
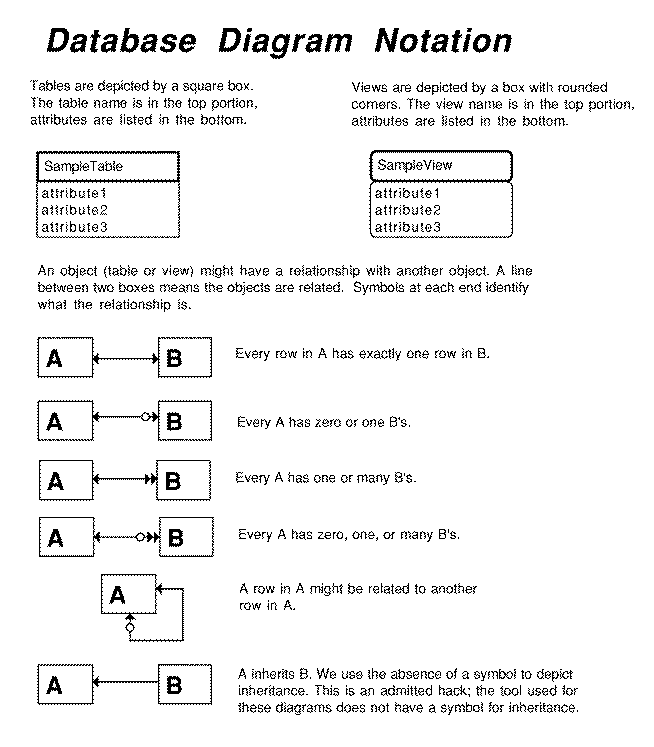
Descriptions of this part of the schema include:
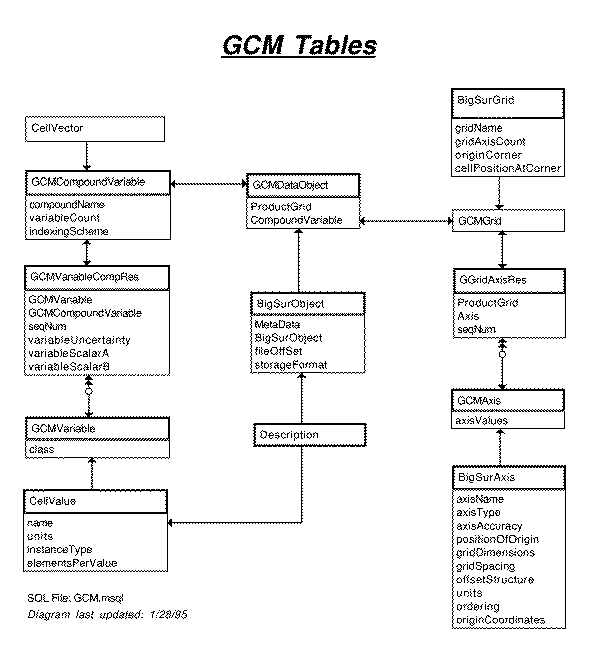
 ERD: GCM Base Tables
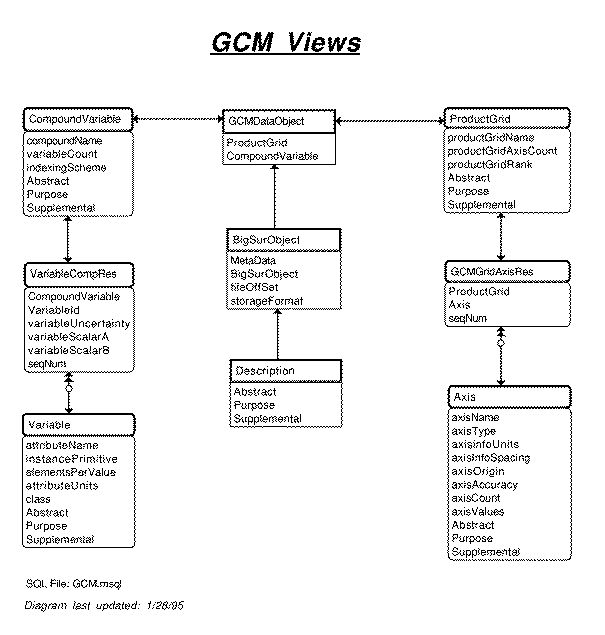
ERD: GCM Views
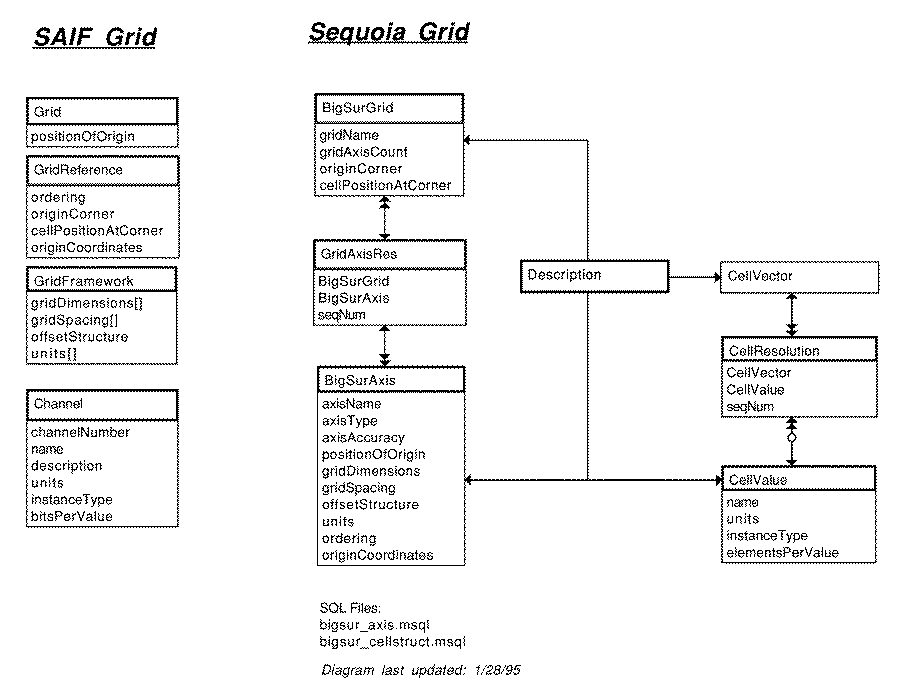
ERD: Big Sur Grid (repeated here for side by side comparisons)
SQL Code
The GCM Views are a good example of how SQL views may be used to tailor the schema the way an end user would like to see it. In this case, some attributes are dropped and others are renamed.
Remote Sensing Data Management
Section Coordinator:
Jean Anderson, jean_anderson@postgres.berkeley.edu
Two projects at the Institute for Computational Earth System Science (ICESS) at U.C. Santa Barbara drive Big Sur design to support remote sensing data:
This section focuses on data characteristics and the BigSur implementation, organized as follows:A satellite platform may have many instruments, each containing one or more sensors. Each sensor has many channels or bands that collect measurements in different wavelengths. For example, the Landsat 5 satellite platform has two instruments, the Thematic Mapper (TM) and Multispectral Scanner (MSS). TM has 7 bands and MSS has 4.
Satellite sensors scan data in lines, the number of samples (also called pixels) per scan-line varying by sensor. These raw digital signals must be processed before they can be used. While the specific processing depends on the sensor, the data undergo the following basic processing steps:
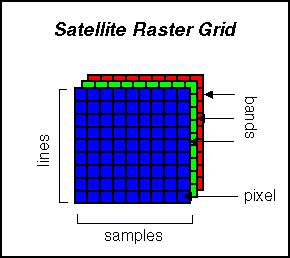 Figure 2.1: Rectified Satellite Raster Image
A few points to keep in mind about these data include:
Typical questions researchers expect to ask the database include (from [DOZI92] and [ALTEOS94]):
The Big Sur schema currently handles AVHRR data. UC Santa Barbara's TOPEX/Poseidon point data is on the 1995 task slate.
Descriptions of this part of the schema include:
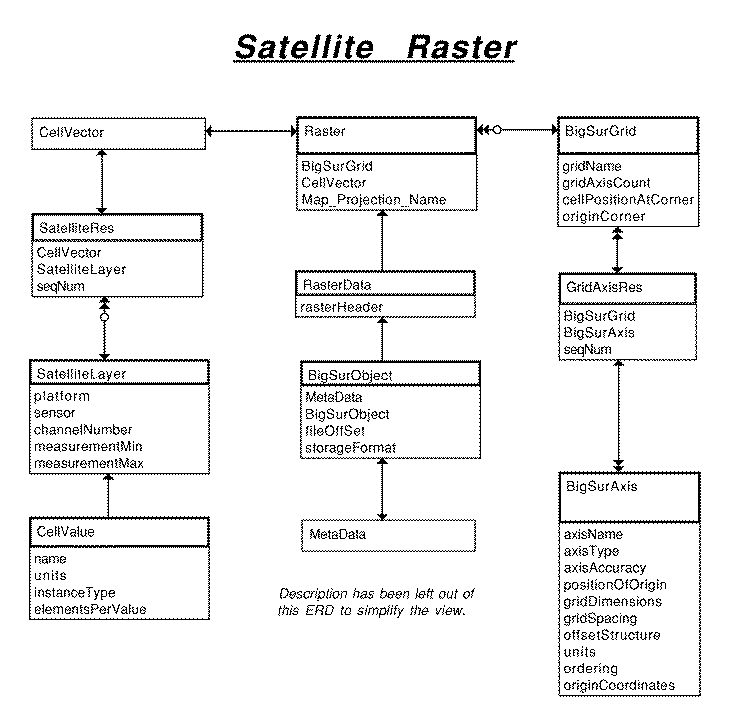
ERD: Satellite Raster Schema
ERD: Big Sur Grid (repeated here for side by side comparisons)
SQL Code
The CellVector suite of tables is used for describing satellite bands. SatelliteLayer stores a description of each band. SatelliteRes associates one or more bands into a group. CellVector attaches that group to a specific raster. This means that a description for a given band only needs to be stored once. It also means that a given raster can have only one band, or it can have any combination of many bands.
Each band description is stored in SatelliteLayer, which inherits the Big Sur CellValue table.
 Sequoia Glossary
 Big Sur Introduction