[Historical Document]
University of California, Berkeley NASA End to End in EOSDIS

Our New World Order...
A Prototype Implementation.

 This is a ROUGH DRAFT under heavy construction.
Please email feedback to the coordinator noted in each section. Please
send general suggestions to rtroy@postgres.berkeley.edu.
This is a ROUGH DRAFT under heavy construction.
Please email feedback to the coordinator noted in each section. Please
send general suggestions to rtroy@postgres.berkeley.edu.
Last update: March 24, 1995
Section contents
Introduction to our Prototype
As a part of the UCB
portion of the National Aeronautics & Space Administration (NASA)
Earth Observing System (EOS), Distributed Information System (DIS), "End
to End" project, we have built a prototype system based on a database and
a small set of application tools. (Our prototype will be growing in scope
and power as time moves on; Watch this page for future developments.)
We call our prototype The New World Order Project because of its ability
to bring order to a world of datasets. One of the key goals of this project
is to provide the ability to "join" disparate datasets to researchers working
in diverse fields, which were not previously possible. We are bringing
together into one database such diverse datasets as satelite imagry, wetlands
data, ariel photographs, 35mm terestrial photographs, newspaper articles,
census data, climatology, river and stream hydrology, and a host of others.
Aside from academic research, such a system would have uses in the society
at large. One example question which cannot be easily answered without
such a system might have to do with public policy: "Given our drought,
just how important are water intensive crops like cotton and rice in preserving
the ecology necessary to sustain migrating waterfowl who have lost their
natural wetlands habitat in this region?" Or, "What sensitive resources
such as schools or endangered specie habitat exist within the geographic
domain of the Environmental Impact Reports submitted by this corporation?"
Questions like these require sophisticated integration of diverse datasets,
and that is part of what our project is all about.
While The New World Order Project cannot answer these questions today,
it is our vision that out of our work will result a system that can. For
more information on our whole project, please see our parent
page.
Our Database Engine
We are implementing our database in a very powerful Database Management
System (DBMS) which combines the "Object Oriented" and "Relational" paradigms,
and permits SQL access to all data. This database engine is Illustra,
a commercial version of the Postgres
DBMS, developed here at UCB as a
research project by Michael Stonebraker.
The combination of the "Object Oriented" paradigm with the Relational
Database Management System (RDBMS) model (thus creating an "ORDBMS") is
very important for our project for several reasons:
-
Unlike traditional RDBMS, it offers ease of extension with "objects", such
as satelite raster images, or atypical datatypes, such as coordinates in
longitude - latitude pairs, while retaining standard SQL access. The system
also offers easy addition of functions, and operators to go along with
new datatypes or objects.
-
And, unlike RDBMSs, it offers inheritence features which permit more logical
database design, improving consistency and ease of access while reducing
the number of tables, and easing the difficulty of performing "joins."
-
Unlike Object Oriented only systems, the Illustra ORDBMS retains the ease
of use on "standard" datatypes, such as text, just as if it were a pure
RDBMS.
-
Because of its wide acceptance, the ability to use "standard SQL" means
that the system is immediately useful to a wide range of individuals, without
need to train them in a specialized toolset.
And, the Illustra ORDBMS offers other important
features:
-
For performance, it has an "R-Tree"
index structure for "spatial" data retrieval. In more traditional systems,
indexes are typically built on "keys" such as Social Security Number, where
a sequential ordering makes quick retrieval possible. Such indexes can
be thought of as single dimension structures because they operate on one
ordered element. In the same way, though much more sophisticated, the R-Tree
index provides a way of locating data in multiple dimensions without having
to examine an entire data set.
-
Because it is a commercial system, its stability and useability is better
assured as there is a staff of professionals maintaining it. Thus, it is
a better choice than the original Postgres DBMS.
Our Database Schema
Our database is based on the Big
Sur - Sequoia schema , which in turn is based on the Federal Geographic
Data Committee (FGDC), Standards for Digital Geospatial Metadata, with
a few extensions. As the Big Sur schema is well described on its own page
(follow the link above), here we focus on the extensions added for our
Prototype. It should be noted that our extensions may not have been necessary;
We created them out of expediency. Through an ongoing evolutionary process,
we are improving our implementation to avoid such extensions, and will
provide feedback to appropriate Standards committees on what we've learned.
We created a "Reference" schema to house some of our extensions to the
database design. (In Illustra, you can have multiple schemas in a single
database.) The Reference schema contains only
those items which can be thought of as providing "reference points" from
which to evaluate the location of other objects. Some examples are a world
map, and State and County/Parish boundaries.
We also created a "GCM" schema for Global Circulation Modeling. The
GCMTest schema
houses that data which is unique to GCM work. In testing various approaches
to GCM visualization, we decided to try our ideas out in an isolated schema.
We haven't yet attempted to reconcile the GCMTest schema with the Big Sur
schema. (...We're not through playing with it yet...)
One GCM visualization issue for us was the actual drawing of representative
shapes indicating detail such as wind direction. This activity can be done
dynamically at run-time as a deriveable attribute, but there is a significant
performance cost for doing so. So, we ended up creating the various shapes
"staticly" instead, and had to store them somewhere - a private schema
seemed the right choice. Reconsiling this work with the Big Sur schema
is an important area for further improvement.
Our Application tools
Our application tools include a combination of SQL (Standard Query Language),
TCL/TK, and an Illustra tool known as the Object Knowledge Browser (OK
Browser). While SQL should be familliar to a wide range of individuals
with computer exposure, the other two may not be familliar. TCL/TK is an
interpreted scripting language that has GUI (Graphical User Interface)
capabilities. The OK Browser is a new type of application development tool
in which the programmer writes virtually no "code." Instead, the OK Project
Editor presents a palate of choices. The programmer chooses from the palate,
places these objects in a "canvas", and joins the chosen objects input
and output ports to each other in meaningful ways.
The result of combining these tools is that we were able to create our
initial application in about 10 days! We used the OK Browser as the initial
viewing tool. When objects (items) are selected, TCK/TK may be brought
up and used to view the selected object in detail. If desired, the user
is given the opportunity to access SQL directly to further their inquery
into the data available. The power handed to the user is considerable,
and the data is largely at their complete disposal.
More importantly, however, once diployed, we want our users, who we
do not insist be highly computer literate, to either create their own applications
or modify the ones we provide to their liking. It is very important that
our users be able to tailor applications to meet their specific needs,
and at the same time, it is important to offer them high-productivity tools
which are easy for them to learn, as they will typically not be Computer
Programmers.
We believe our prototype system illustrates how such a system might
be brought together. But we have just begun. We anticipate integration
of a host of more specialized tools so that investigators may quickly move
from one application environment to another, passing items of interest
between the applications without difficulty.
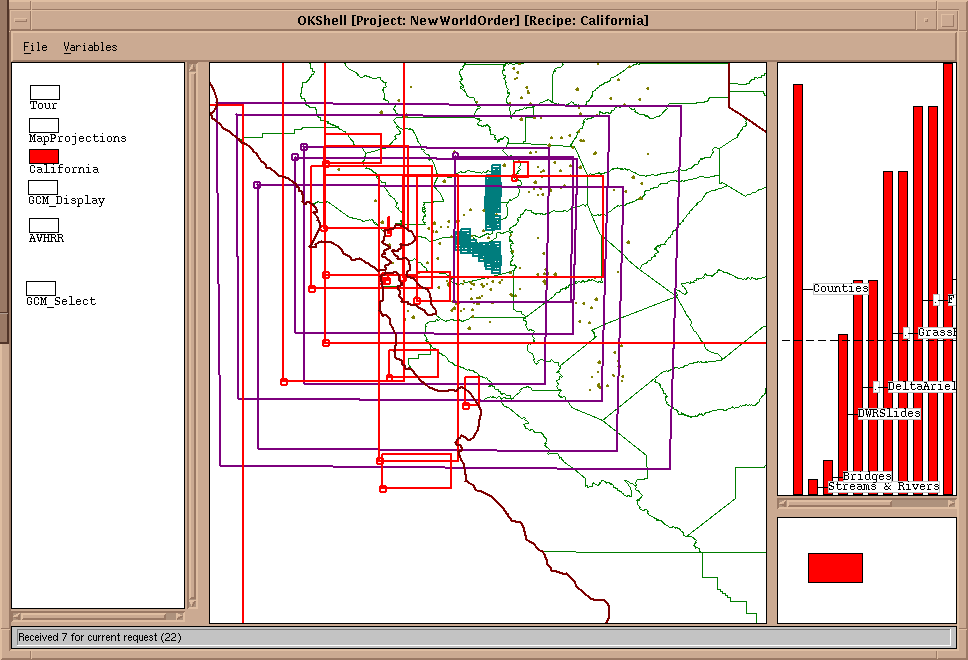
As an example, when viewing the New World Order application, please
note the " Grass
rasters." These rasters (images) are generated by an application which
is presently wholely seperate from this one. By integrating these two applications,
we intend to permit the user to select and display Grass rasters via the
New World Order application, and quickly move to the other application
for a more specialized interaction with the data.
Our Data
Our data sets include a diverse collection, all of which share a few key
attributes. Chief among these is a "spatial" element. The spatial element
is usually a "geo-location" on the Earth. While we realize the Earth is
indeed 3 dimensional, a more common representation is a two dimensional,
spherical geometry based approach with an agreed origin: Latitude and Longitude!
We use the latitude/longitude system for much of our data (much of it was
available to us in this form), though we are not restricted to it. Future
work will include the flexibility to support coordinates in a projected
form, such as Albers Equal Area, which uses Meters Easting & Northing.
But for now, we coerce such data into Lat/Long (decimal form, ie no minutes
and seconds).
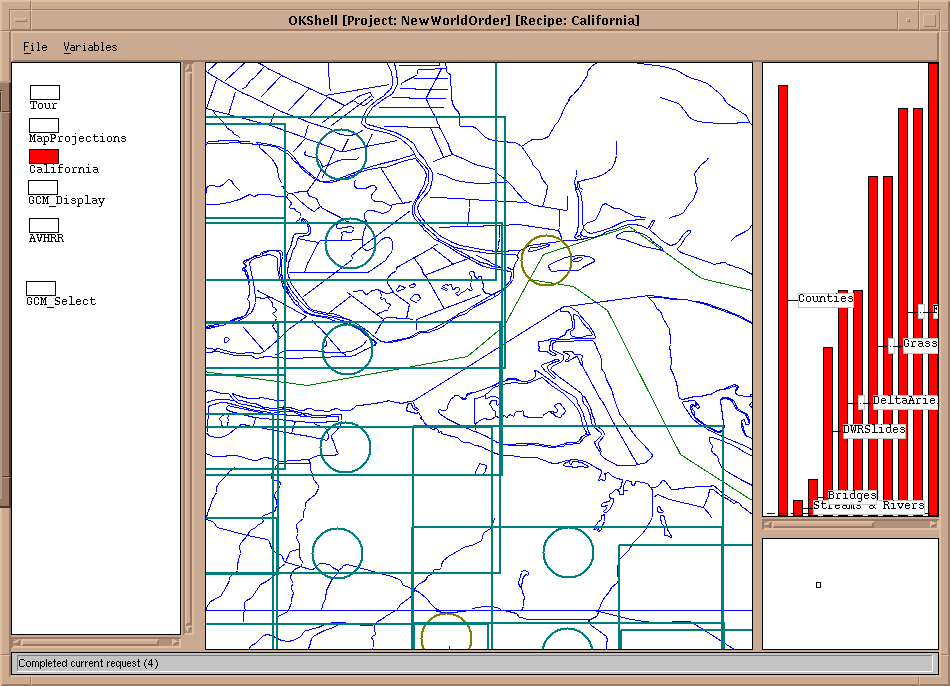
Spatial data can be of three forms: point, path, and polygonal:
-
Point data is simply an X,Y pair, and is the foundation for the other two
forms. Generally it could be argued that virtually all geo-located items
have an area they cover, and so should not be located by a single
point. However, as a practical matter, in many cases geo-location data
is collected as a single X,Y (longitude, latitude) point. In these cases,
the area data may be lost, or is simply considered unimportant.
-
Path data is a series of points, and each successive pair defines a line
segment. This data may represent a river or a road. Again, data collected
in this way may loose area information, so it might not be possible to
answer the question "how much land area does this river cover" without
making width assumptions. It should be noted that occasionally data collectors
measuring such objects as rivers collect data for each side so that one
ends up with two paths for the object. This is the case with the
Topologically Integrated Geographic Encoding and Referencing System ("Tiger")
based hydrological data (rivers and streams).
-
Polygons are simply paths whose last point is the same as the first, and
so are "closed." Polygons (often abreviated as simply "poly") are uniquely
usefull as they are the only form capable of conveying area information
directly. Polygons are most often used for things such as State boundaries.
Our data comes to us from several sources and we are constantly adding
more. Presently, our data sets include:
-
World Map
Includes major political boundaries, provided by the Central
Intelligence Agency (CIA).
-
US State and County/parish Maps
Provided by the USGS and/or census
Tiger data.
-
AVHRR images.
Advanced Very High Resolution Radiometer images are taken by satelites
and go through numerous processing stages.
-
Geographic Resources Analysis Support System (GRASS) Rasters.
Grass
is a geographic information system (GIS) used to analyze and display data.
Like many GIS software toolkits, GRASS provides tools for data conversion
, digitizing, management, analysis, overlay, and display. Its particular
strengths include geographic modeling - overlaying and combining different
geodata based on location and description.
-
Ariel photographs of the Sacramento (California) river delta.
-
DWR (California Department of Water Resources) 35mm slide library.
-
"Flood text"
San Francisco Chronicle articles related to the recent (Jan-Feb 1995)
flooding in California. These articles were "hand geo-located" by us, but
could possibly be geolocated by a tool known as GYPSY.
-
"Points of Interest"
This data is from the California place name registry.
-
GCM Test data
This data was created by us to simulate a real Global Circulation Model
visualization in our prototype. We expect to soon update our visualization
display, and use real data.
Our Prototype
Our prototype is called the New World Order Project, and is based on the
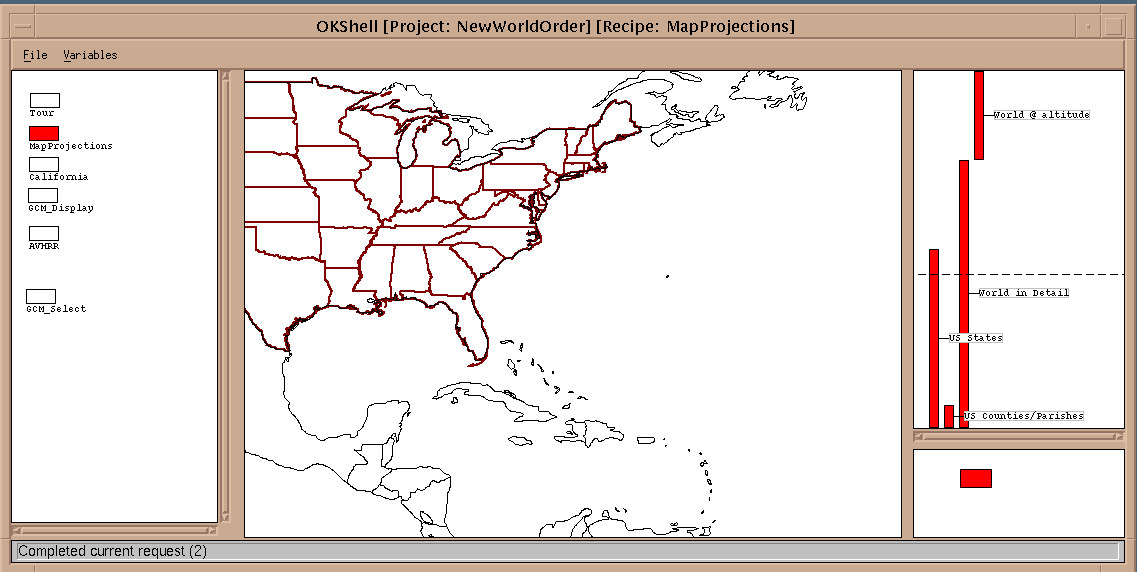
items outlined above. One enters the environment by running the "OK Shell."
The OK Shell runs "X" so the user, the program running OK and the database
engine may all be on different systems! OK starts by bringing up the first
"Recipe", and from there the user may run different recipes simply by clicking
on them.
The following is a sample of what you would see as you enter the application.
The default is to see a large swath of the Earth, including the whole eastern
seaboard of the US:
Acknowledgements
P. Brown (UCB) and R. Troy (UCB)
Section Coordinator: Richard Troy, rtroy@postgres.berkeley.edu